
By Adam Pagnucco.
Last fall, MCPS released its spring 2024 Maryland Comprehensive Assessment Program (MCAP) results by school. For the first time my sources can remember, MCPS released them in spreadsheet format rather than pdf, a positive step for transparency. As for the results themselves, well… keep reading.
Let’s start with elementary schools. The table below shows a summary of results for all elementary schools in English Language Arts/Literacy and math by demographic group. Overall, 54% of students were rated as proficient in literacy and 45% were rated as proficient in math. There were wide gaps among sub-groups.
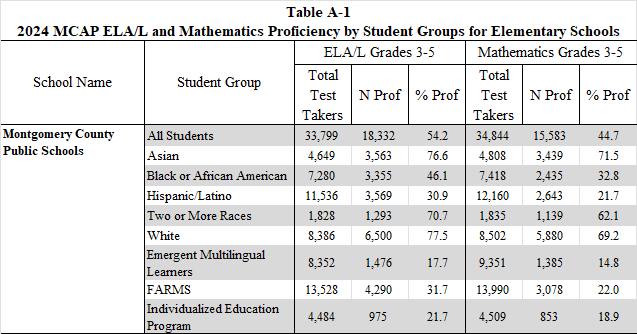
The gaps across schools were huge. 131 elementary schools reported results. 75 schools reported that a majority of all students were proficient in literacy and 59 reported that a majority were proficient in math. Among Black students, 55 schools reported that a majority were proficient in literacy and only 15 reported that a majority were proficient in math. Among Latino students, 30 schools reported that a majority were proficient in literacy and only 16 reported that a majority were proficient in math.
Now let’s look at middle schools. The table below shows a summary of results for all middle schools in literacy, math and Algebra 1 by demographic group. Overall, 54% of students were rated as proficient in literacy, 18% were rated as proficient in math and 43% were rated as proficient in Algebra 1. Again, there were wide gaps among sub-groups.
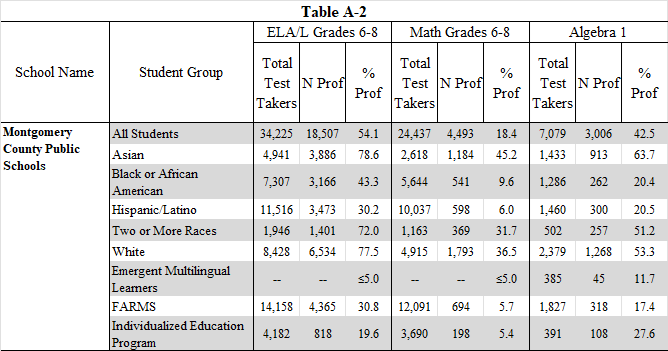
Variation among schools was considerable in literacy and Algebra 1 whereas most results in math were subpar. 40 middle schools reported results. 19 schools reported that a majority of all students were proficient in literacy, 9 reported that a majority were proficient in Algebra 1 and only 1 (Thomas W. Pyle MS in Bethesda) reported that a majority were proficient in math. Ten middle schools reported that less than 10% of all students were proficient in math.
Among Black students, 14 schools reported that a majority were proficient in literacy, just two reported that a majority were proficient in Algebra 1 and none reported that a majority were proficient in math. Nineteen middle schools – nearly half of them – reported that less than 10% of Black students were proficient in math.
Among Latino students, 8 schools reported that a majority were proficient in literacy, 4 schools reported that a majority were proficient in Algebra 1 and none reported that a majority were proficient in math. Twenty-nine middle schools – almost three-quarters of them – reported that less than 10% of Latino students were proficient in math.
Let’s finish with high schools. The table below shows a summary of results for all high schools in literacy and Algebra 1. Overall, 61% of students were rated as proficient in literacy and 5% were rated as proficient in Algebra 1. Literacy had variation among sub-groups but Algebra 1 scores were almost all bad.
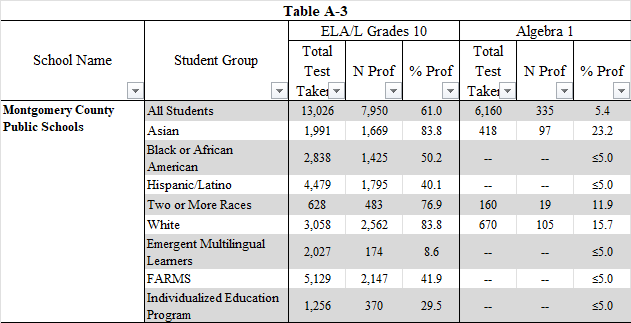
25 high schools reported results. In terms of literacy, 17 reported that a majority of all students were proficient, 12 reported that a majority of Black students were proficient and just 6 reported that a majority of Latino students were proficient. In terms of Algebra 1, no schools reported that a majority of all students, Black students or Latino students were proficient. To the contrary – 20 schools reported that less than 10% of all students were proficient, 22 reported that less than 10% of Latino students were proficient and 24 reported that less than 10% of Black students were proficient.
Why are Algebra 1 results so much worse in high school than middle school? Algebra 1 can be taken at either level and most students take it in middle school. High school students taking Algebra 1 are a different group and face challenges associated with taking the class later.
This column concentrates on race a lot, but economics matters too. The scatter charts below provide an example. On each chart, each dot represents an elementary school. On the horizontal axis, the median household income in 2018-22 of each school’s zip code is plotted. On the vertical axis, the percentage of Black elementary students (in the first chart) and Latino elementary students (in the second chart) who were proficient in math is plotted. See the upward sloping line of best fit? That shows the positive relationship between household income and proficiency.
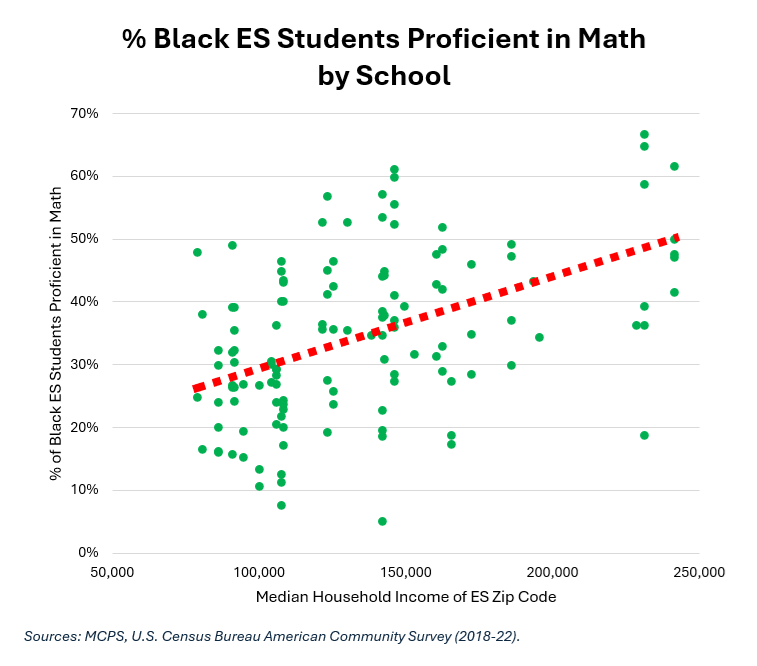
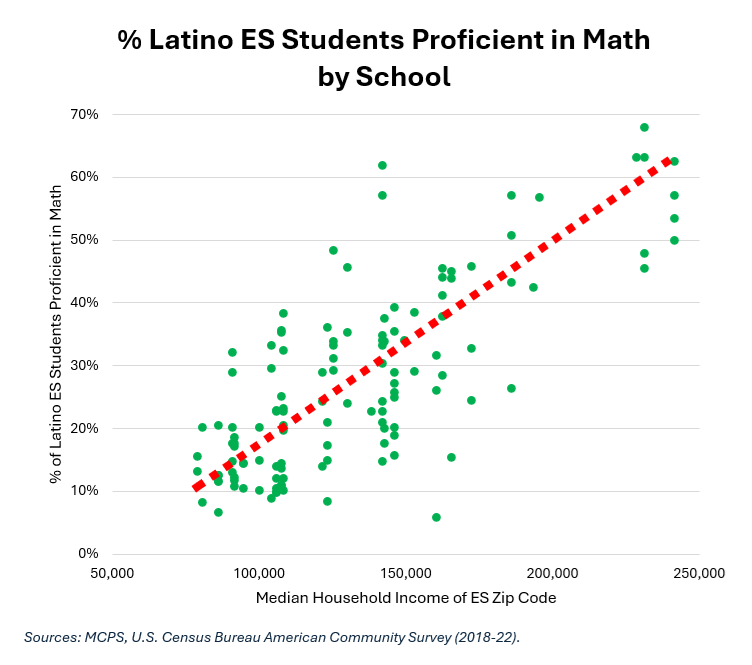
The correlation coefficient for Black elementary students and median household income is +0.48, a moderate positive correlation. The correlation coefficient for Latino elementary students and median household income is +0.81, a strong positive correlation. I found similar correlations when comparing literacy results to household incomes.
It’s not just about race, folks. Economics helps explain variation in scores inside the Black and Latino student populations. This is another important dividing line in MCPS.
MCPS deserves credit not just for releasing these scores but also releasing them in spreadsheet format. That significantly increased the speed of these calculations. This particular sheet did not contain comparative data for prior years to enable evaluation of progress. Hopefully the new regime will add that data in the future.
Now to the scores themselves. The overall impression here is not that they are uniformly bad. Rather, from a statistical perspective, the dominant characteristic of these scores is their extreme variability. There are quite a few success stories and also a lot of problems, the latter often concentrated in particular schools and sub-groups.
Folks, is this what a high-performing school system looks like?
https://montgomeryperspective.com/2024/12/11/mcpss-troubling-literacy-and-math-scores/